Viewing your report
Viewing your report
To view the result of the query you have built, use the Run option from the main menu.

This will produce a report as shown below:
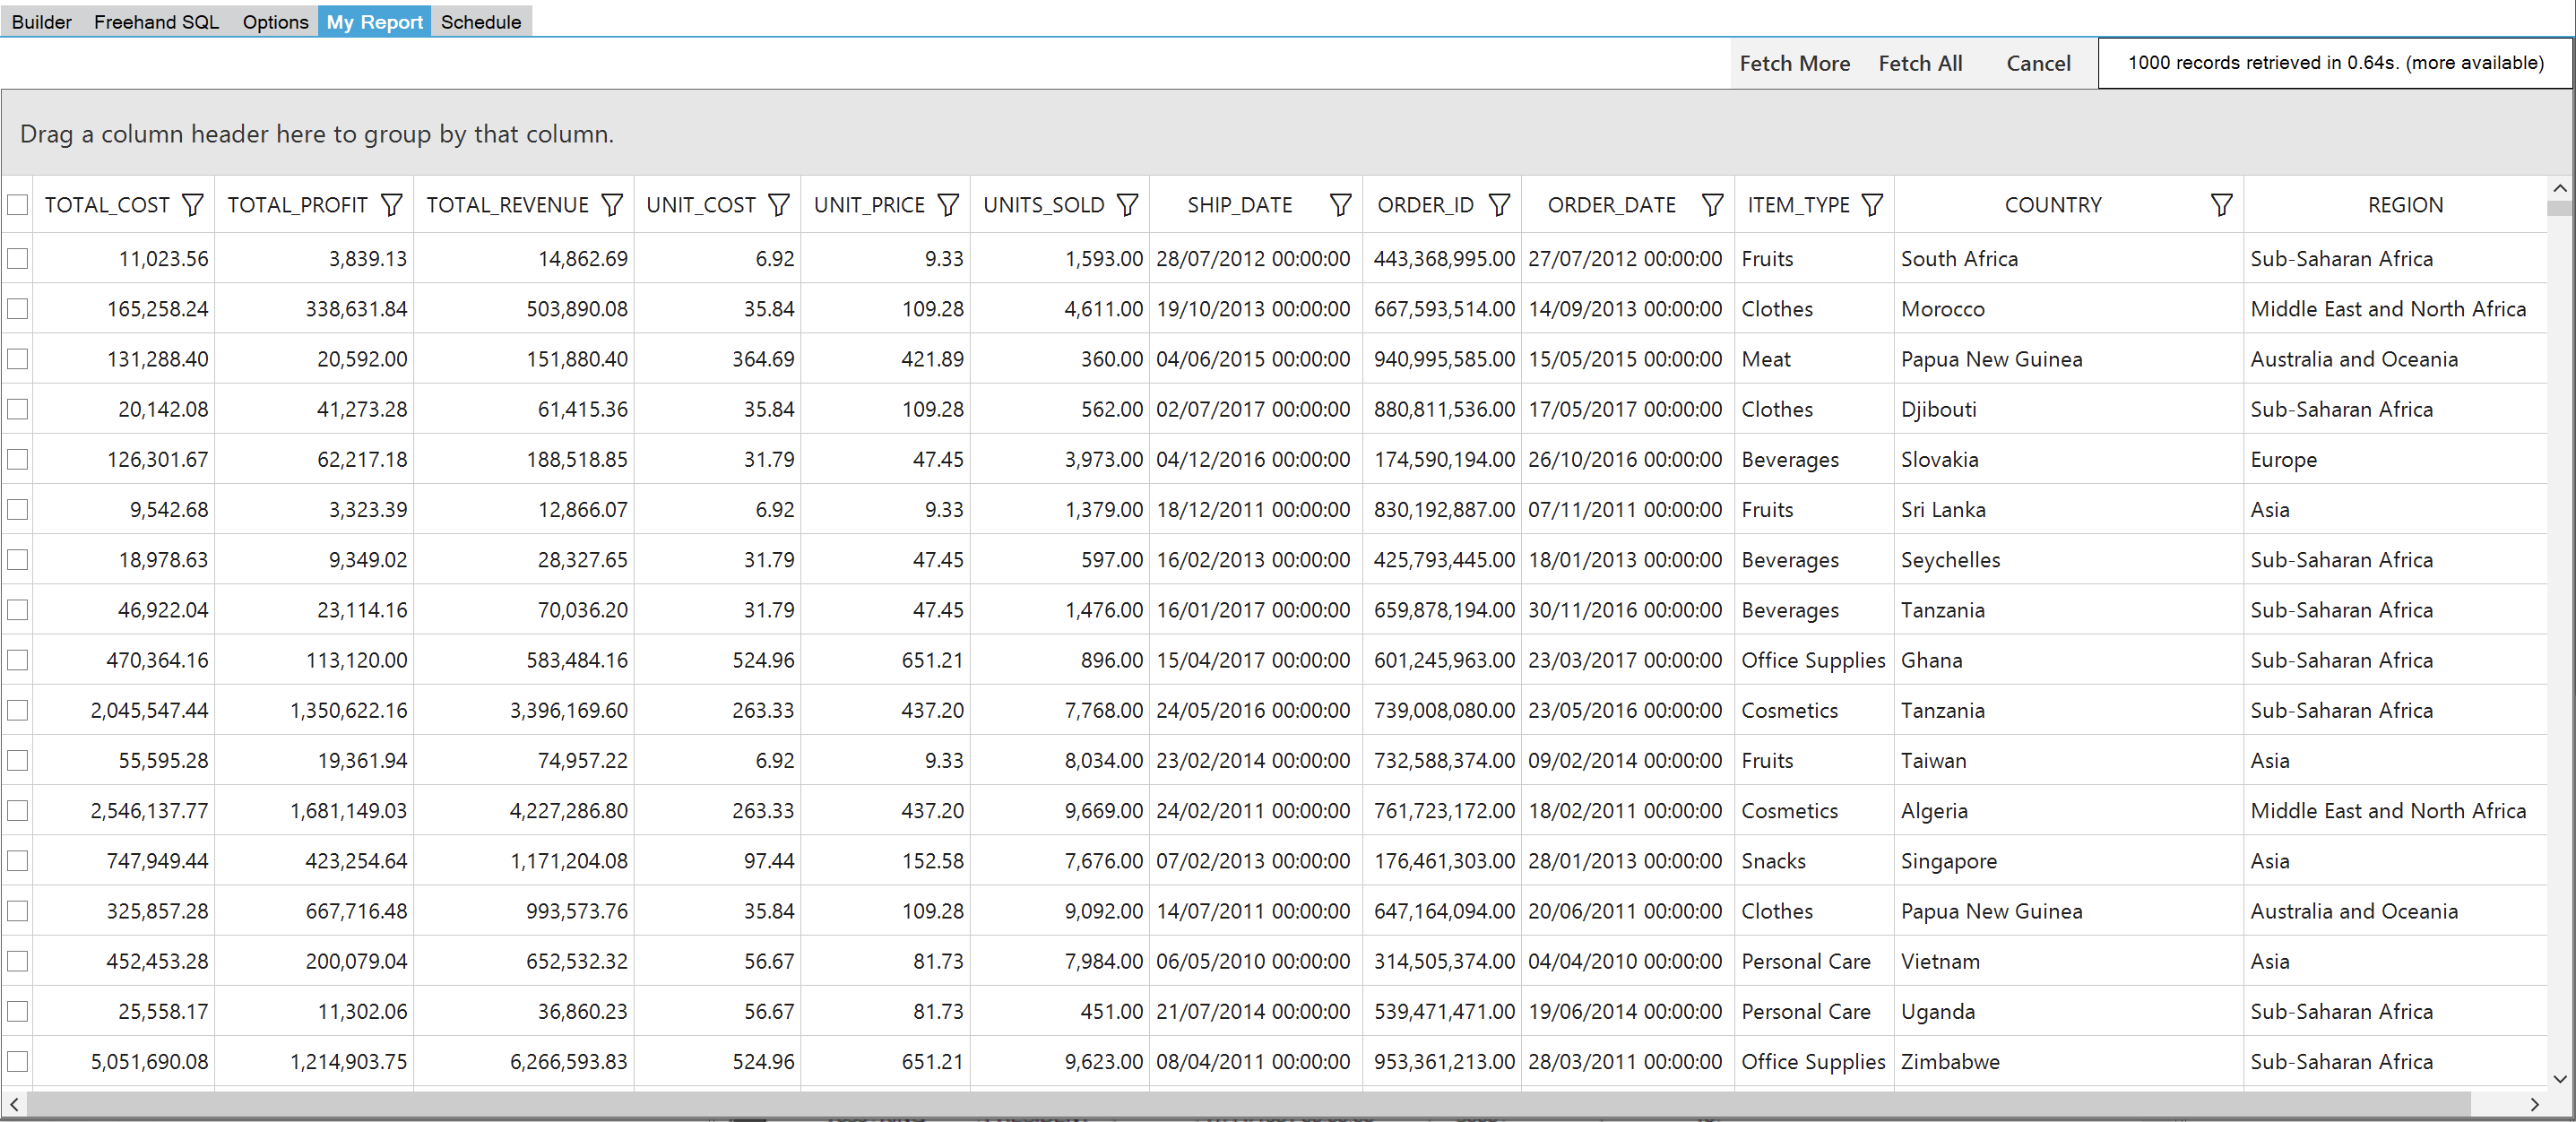
The report is in the My Report panel. You can switch between this and the Builder tab by clicking on the panel headings.
You can manipulate the report in the following ways:
- Adjust column widths by dragging the boundaries between column headers.
- Change the order of columns by dragging the column header and dropping it between other columns.
- Sort the data by double clicking on the column header. Double click again to sort the data in the reverse order.
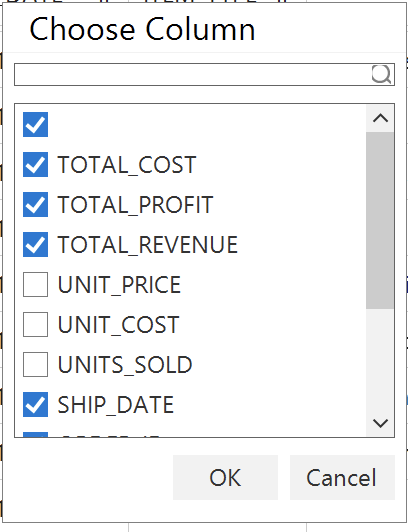
- Hide/show columns in the selected table by right clicking on any column header and using the field chooser to select columns.
![]()
- Select data using the check boxes on the left of each row. Use the top check box to the left of the column headers to select all data. The selection can then be copied and pasted into Excel using keyboard shortcuts (Ctrl+C and Ctrl+V).
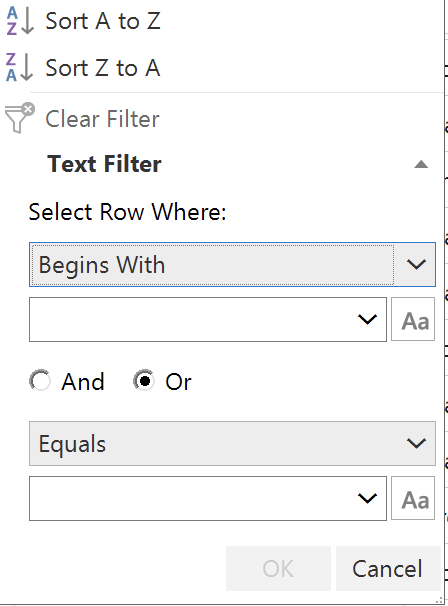
- Click the filter icon to open the filter menu:
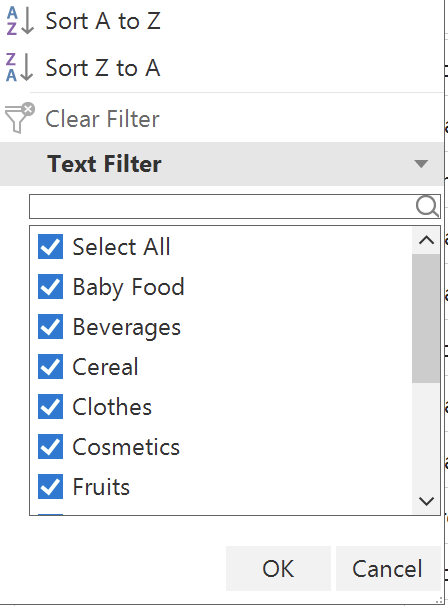
Use the check boxes to filter data. Click the text/number filter (dependent of type of data) to filter using logical operators.
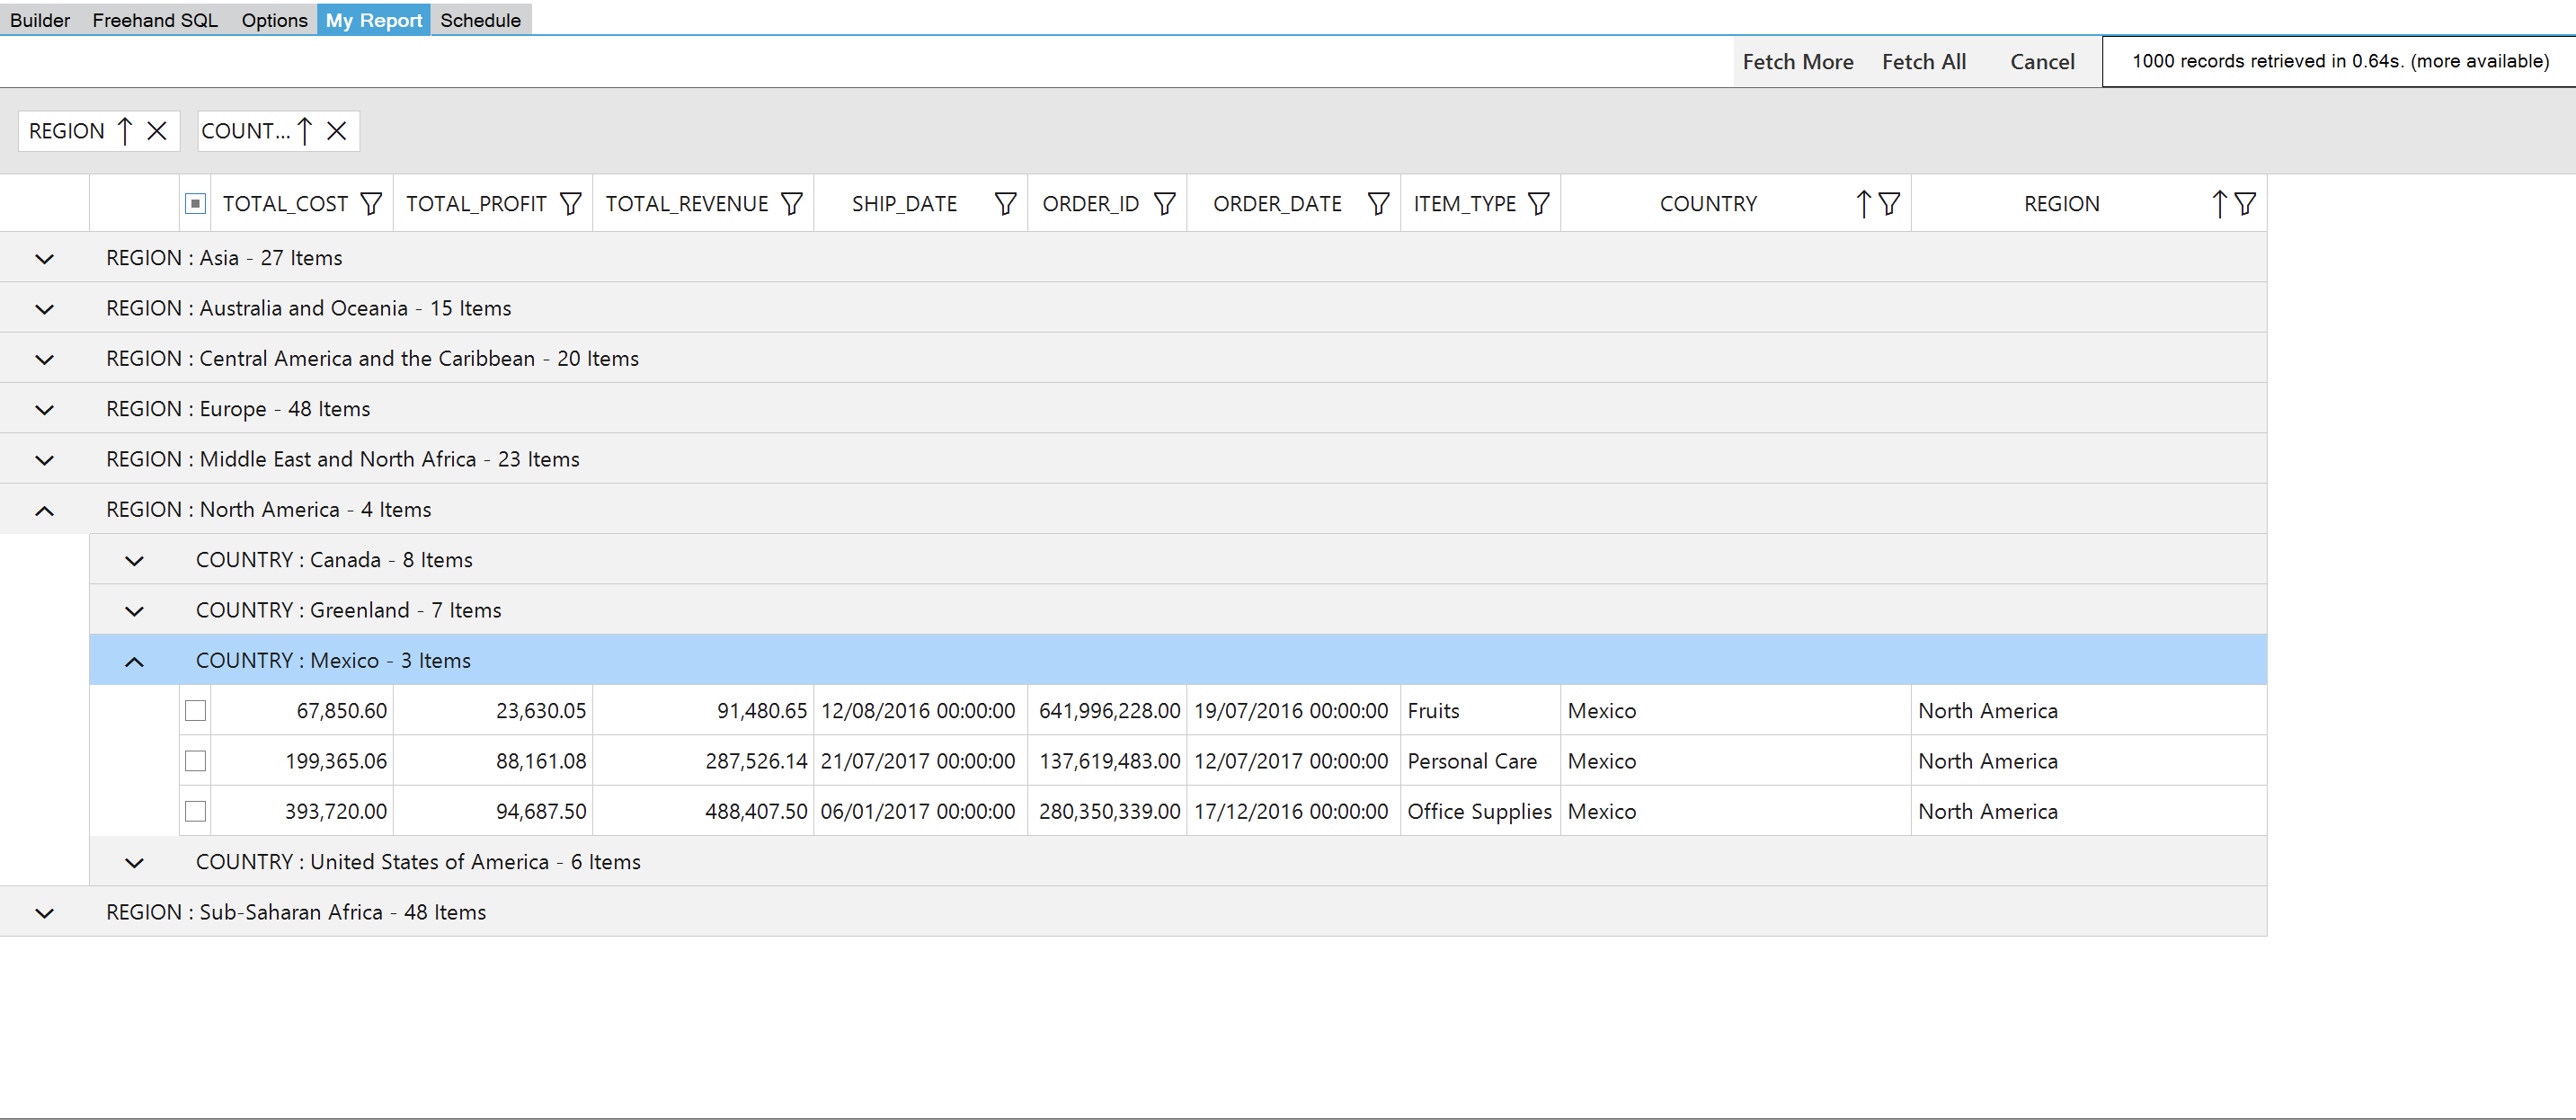
- Drag a column heading into the Grouping box above the column headers. This organises the rows into groups. Click on the [+] symbol by the group to expand it into its constituents.
- You can include more than one group.
The example below shows the sales data table grouped by country within region. Mexico is expanded to show its 3 orders.
